Page 242 - ENAV eng_Relazione_Finanziaria_Annuale_2014
P. 242

240 ENAV – 2014 Financial Statements

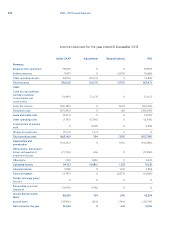
                            Income statement for the year ended 31 December 2013

Revenues                    Italian GAAP    Adjustments       Reclassifications          IFRS

Revenues from operations           778,153                 0                      0  778,153
                                    21,477                 0               (1,017)    20,460
Balance revenues                   64,035         (10,173)                            53,862
                                  863,665         (10,173)                        0  852,475
Other operating income                                                     (1,017)

Total revenues                (4,084)        (1,573)                 0                  (5,657)

Costs                       (192,385)               0           (976)                 (193,361)
                            (397,495)               0              681               (396,814)
Costs for raw materials.                            0                0
Ancillary materials.           (4,914)      (5,798)                  0                   (4,914)
Consumables and                (2,747)        6,502                  0                  (8,545)
merchandise                                    1,573                 0
                                      0         704                                       6,502
Costs for services             (1,573)              0           (295)                           0
                            (603,198)                           2,987
Personnel costs             (153,367)           696                                  (602,789)
                                                                     0               (150,380)
Lease and rental costs       (12,254)         3,887
                                            (4,886)                  0                  (11,558)
Other operating costs             (84)                           1,675
                               94,762               0            1,814                    3,803
Capitalization of internal                          0         (2,073)                     91,551
work                             3,038              0                                     4,852
                               (4,787)                               0                  (6,860)
Change in inventories                         4,990
                                      11                             0                          11
Total operating costs                            104
                              (4,990)         (104)              1,416                          0
Depreciation and                                                (764)
amortization                   88,034               0                                    89,554
                             (37,506)                             652                  (38,374)
Write-downs. Impairment
losses and reversal of         50,528                                                     51,180
impairment losses

Allocations

Operating income

Financial income

Financial expense

Foreign exchange gains/
(losses)

Extraordinary income/
(expense)

Income before income
taxes

Income taxes

Net income for the year
   237   238   239   240   241   242   243   244   245   246   247