
Page 46 - ENAV eng_Relazione_Finanziaria_Annuale_2014
P. 46
44 ENAV – 2014 Financial Statements
Economic performance and financial position
of the enav Group
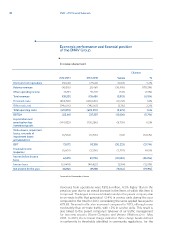
Income statement
Changes
%
31.12.2014 31.12.2013 Values
812,638 4.2%
Revenues from operations (16,016) 779,602 33,036 (178.3%)
38,913 20,460 (36,476)
Balance revenues 835,535 39,426 (1.3%)
839,488 (513) (0.5%)
Other operating income (466,198) (459,640) (3,953)
(145,676) (142,561) (6,558) 1.4%
Total revenues (611,874) (602,201) (3,115) 2.2%
237,287 (9,673) 1.6%
Personnel costs 223,661 (13,626) (5.7%)
Other costs, net (144,025) (135,286) (8,739) 6.5%
Total operating costs (6,564) (8,706) 2,142 (24.6%)
EBITDA 73,072 93,295 (20,223) (21.7%)
(5,602) (3,305) (2,297) 69.5%
Depreciation and
amortization less 67,470 89,990 (22,520) (25.0%)
investment grants 12,958 (32.1%)
(27,464) (40,422) (9,562) (19.3%)
Write-downs, impairment 40,006 49,568
losses, reversals of
impairment losses
and allocations
EBIT
Financial income
(expense)
Income before income
taxes
Income taxes
Net income for the year
Amounts in thousands of euros
Revenues from operations were ¤812.6 million, 4.2% higher than in the
previous year due to an overall increase in the items of which this item is
composed. The largest increase is linked mainly to the parent company due
to en-route traffic that generated +2.4% in service units during the year
compared to the total for 2013, considering the same applied fee equal to
¤78.83. Terminal traffic also increased compared to 2013, although more
moderately than en-route traffic, with +2% in service units. This result is
also linked to the parent company’s takeover of air traffic management
for two new airports (Rome Ciampino and Verona Villafranca) in May
2014. In 2014, the terminal charge called for three charge bands defined
in conformity to thresholds identified in community regulations. For the