
Page 52 - ENAV eng_Relazione_Finanziaria_Annuale_2014
P. 52
50 ENAV – 2014 Financial Statements
Economic performance, operating results, financial
position and cash flows of enav
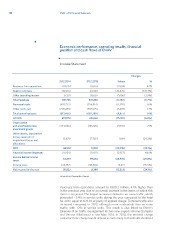
Income Statement
Changes
%
31.12.2014 31.12.2013 Values
810,251 4.1%
Revenues from operations (16,016) 778,153 32,098 (178.3%)
37,501 20,460 (36,476)
Balance revenues 831,736 38,607 (2.9%)
837,220 (1,106) (0.7%)
Other operating income (403,213) (396,814) (5,484)
(209,453) (205,975) (6,399) 1.6%
Total revenues (612,666) (602,789) (3,478) 1.7%
234,431 (9,877) 1.6%
Personnel costs 219,070 (15,361) (6.6%)
Other costs, net (144,666) (135,125) (9,541) 7.1%
Total operating costs (5,871) (7,755) 1,884 (24.3%)
EBITDA 68,533 91,551 (23,018) (25.1%)
(4,954) (1,997) (2,957) 148.1%
Depreciation (25,975) (29.0%)
and amortization less 63,579 89,554 13,622 (35.5%)
investment grants (12,353) (24.1%)
(24,752) (38,374)
Write-downs, impairment 38,827 51,180
losses, reversals of
impairment losses and
allocations
EBIT
Financial income (expense)
Income before income
taxes
Income taxes
Net income for the year
Amounts in thousands of euros
Revenues from operations amount to ¤810.2 million, 4.1% higher than
in the previous year due to an overall increase in the items of which this
item is composed. The largest increase is linked to en-route traffic, which
generated +2.4% in service units during the year compared to the total
for 2013, equal to ¤78.83 at parity of applied charge. Terminal traffic also
increased compared to 2013, although more moderately than en-route
traffic, with +2% in service units. This result is also linked to ENAV’s
takeover of air traffic management for two new airports (Rome Ciampino
and Verona Villafranca) in late May 2014. In 2014, the terminal charge
called for three charge bands defined in conformity to thresholds identified