
Page 19 - ENAV eng_Relazione_Finanziaria_Annuale_2014
P. 19
Report on Operations 17
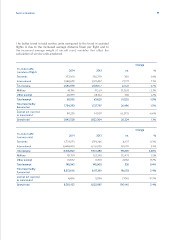
The better trend in total service units compared to the trend in assisted
flights is due to the increased average distance flown per flight and to
the increased average weight of aircraft used, variables that affect the
calculation of service units produced.
Change
En-route traffic 2014 2013 no. %
(number of flights 337,020
Domestic 1,348,678 336,720 300 0.1%
International 1,685,698 1,321,457 27,221 2.1%
Total paying 1,658,177 27,521 1.7%
Military 40,196 (1,363) -3.3%
Other exempt 28,399 41,559 1.2%
Total exempt 68,595 28,061 338 -1.5%
Total reportedby 1,754,293 69,620 (1,025)
Eurocontrol 1.5%
Exempt not reported 88,235 1,727,797 26,496
to Eurocontrol 1,842,528
Grand total 94,507 (6,272) -6.6%
2014 1,822,304 20,224 1.1%
En-route traffic 1,723,573
(service units) 6,444,430 Change
Domestic 8,168,003
International 2013 no. %
Total paying 131,701
Military 13,842 1,719,246 4,327 0.3%
Other exempt 145,543 6,253,139 191,291 3.1%
Total exempt 8,313,546 7,972,385 195,618 2.45%
Total reportedby (1,547) -1.2%
Eurocontrol 4,886 133,248 17.7%
Exempt not reported 8,318,432 11,760 2,082 0.4%
to Eurocontrol 535
Grand total 145,008 2.4%
8,117,393 196,153
5,594 (708) -12.7%
8,122,987 195,445 2.4%